Mean and Median Demonstration
Instructions This demonstration shows how the relative size of the mean and the median depends on the skew of the distribution. The demonstration begins by showing a histogram of a symmetric distribution (no skew). The mean and median are both 5.0. The mean is shown on the histogram as a small blue line; the median is shown as a small purple line. The standard deviation is 1.81. A red line extends one sd in each direction from the mean. The standard deviation is calculated assuming the data portrayed in the graph represent the entire population. You can change the values of the data set by "painting" the histogram with the mouse. Change the distribution in various ways and note how the skew affects whether the mean is bigger than the median or vice versa.
Illustrated Instructions 
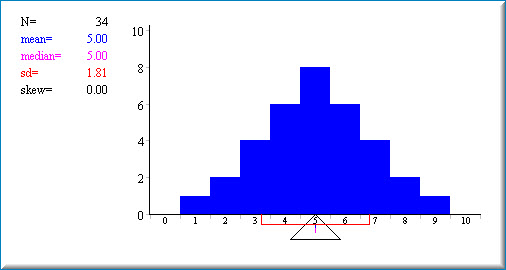
The simulation starts out with a symmetrical distribution. As can be seen seen in the screenshot below the mean and median are equal and there is 0 skew. 
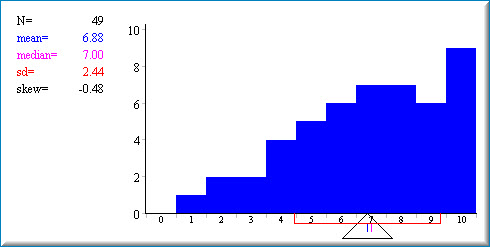
The distribution can be changed "painting" it with the mouse. Below is an example of a negatively skewed distribution. Note that the mean and median are no longer equal to each other. Trying painting several different types of distributions to see how mean and median values are affected relative to each other.
We recommend you answer the questions even if you have to guess. Then use the simulation to help you verify your answers. After interacting with the simulation click the "Check Answer" button.
"Paint" the distributon with the mouse and observe the effects. The mean and median are shown to the left and also as small vertical bars below the X-axis. The mean is in blue and the median is in pink.